





 By Omri Shafran
CEO, Texas Logistic & Fulfillment Services
LinkedIn profile
Did you know? The Fulfillment Advisor's 2026 average picking accuracy of 99.41% translates to 59 errors per 10,000 picks if applied at that scale. This is a benchmark conversion, not observed TLS errors. Ask whether your provider measures accuracy by order, line, or unit before comparing percentages. Source.
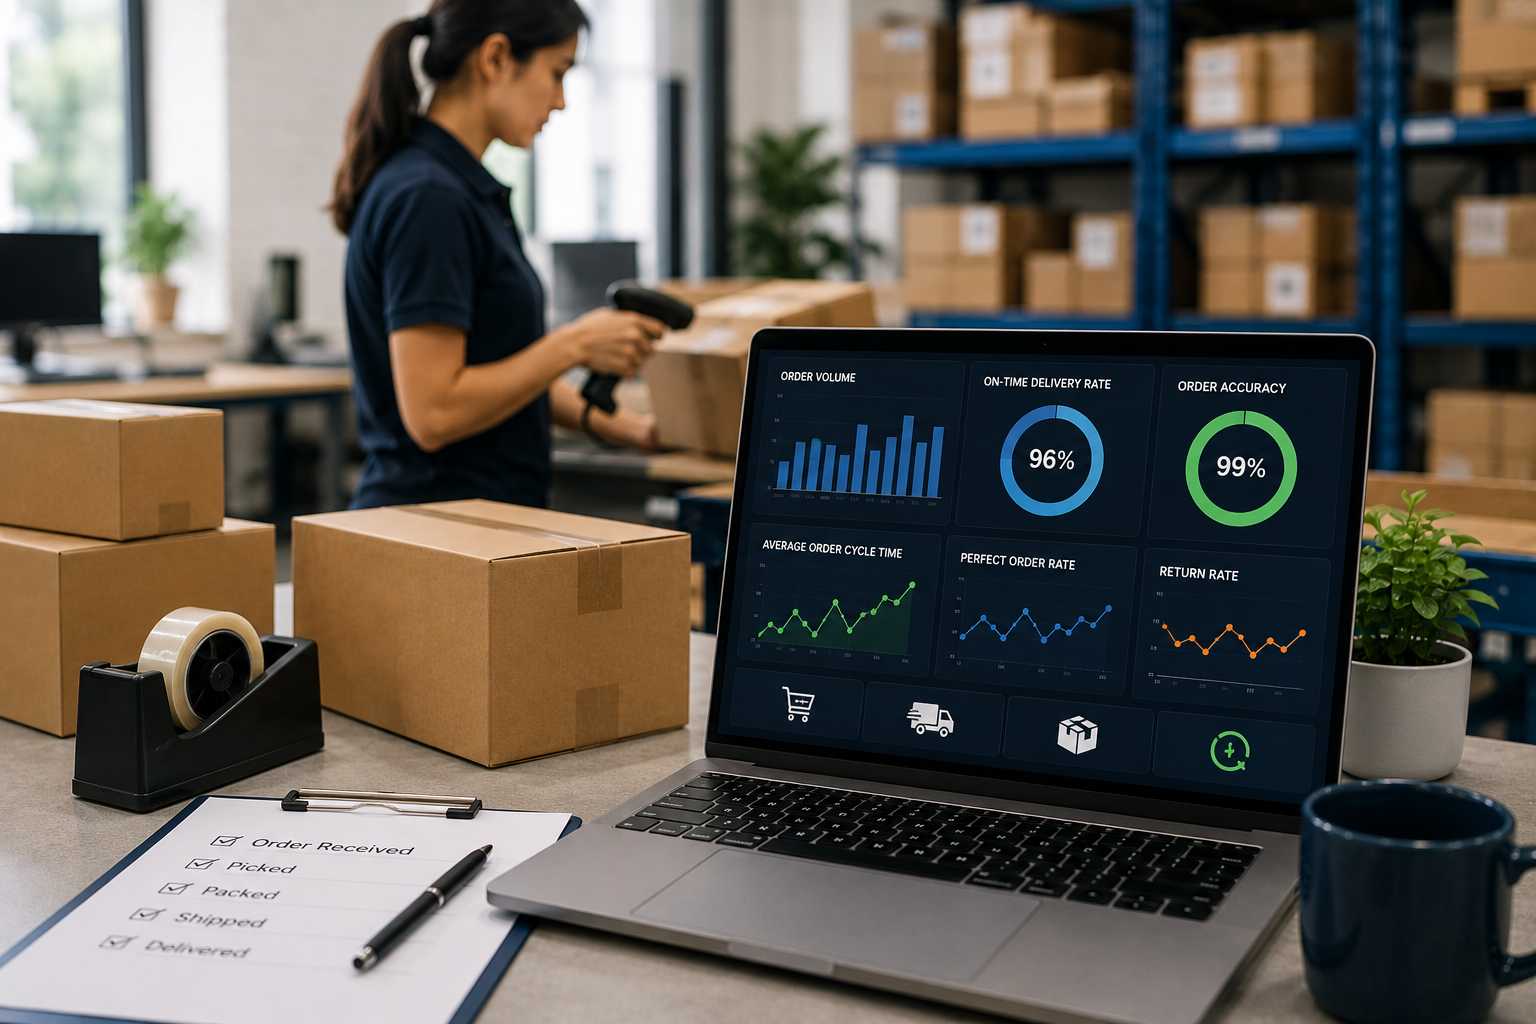
The order fulfillment KPIs that matter most for e-commerce brands are: order accuracy rate, on-time ship rate, order cycle time, fill rate, return rate, cost per order, and inventory turnover. Each metric measures a different failure point in the fulfillment chain. Tracking all seven gives you enough visibility to diagnose performance problems before they reach customers or erode margins.
Most fulfillment problems show up in customer service tickets and refund requests before they show up in your data. By the time a pattern is obvious in your reviews, the operational gap has already been running for weeks. KPI tracking flips that timeline – you see the deterioration in the numbers first, which gives you a window to fix it before it compounds into a retention problem.

The challenge for most e-commerce brands is choosing which metrics are worth the overhead of tracking. There’s no shortage of data in a modern fulfillment operation, but plenty of it is noise. The KPIs covered here are not vanity metrics. Each one maps to a specific cost, a specific customer experience outcome, or a specific operational failure mode. If your fulfillment partner can’t report on them, that’s worth knowing.
Whether you’re running pick, pack and ship in-house or through a 3PL, these are the numbers your team should be reviewing on a defined cadence – weekly for high-velocity operations, monthly at minimum for everyone else.
1. Order Accuracy Rate
Order accuracy rate measures the percentage of orders shipped with the correct items, quantities, and SKUs. The formula is straightforward: correct orders divided by total orders shipped, expressed as a percent. A rate of 99.5% sounds strong until you’re shipping 10,000 orders a month – at that volume, 0.5% means 50 wrong shipments, each generating a return, a replacement, a customer service exchange, and potential review damage.
Best-in-class fulfillment operations maintain order accuracy above 99.9%. If your rate is running below 99.5%, the problem is almost always in the pick process: pick lists with insufficient SKU specificity, bins that share too much shelf space with visually similar products, or a pick verification step that’s treated as optional under volume pressure. Barcode scanning at pick and a mandatory scan-verify before packing are the two changes that move this metric fastest.
Track this metric at the SKU level, not just overall. A 99.8% overall rate can mask a single problematic SKU running at 95% accuracy that accounts for a disproportionate share of your error tickets. Pull the breakdown and look for outliers.
2. On-Time Ship Rate
On-time ship rate is the percentage of orders shipped by the promised ship date or within your stated handling time window. If your product listings promise same-day shipping on orders placed before 2 PM, your on-time ship rate measures how often you actually hit that cut-off. Miss it and the carrier SLA doesn’t matter – the customer already received a delivery estimate that’s a day short.
This metric lives at the intersection of your order management system, your warehouse pick and pack throughput, and your carrier cut-off times. Volume spikes are the most common cause of on-time ship rate degradation. If you can process 400 orders a day comfortably but routinely receive 600 during promotional periods, your on-time rate will drop predictably unless you have staffing or overflow capacity ready. The metric tells you the outcome; your labor planning tells you the cause.
For brands working with a 3PL warehousing and fulfillment partner, on-time ship rate is a contractual performance benchmark, not a courtesy metric. Your SLA should specify the minimum acceptable rate – typically 98% or higher – and your partner should be reporting actuals against it on a regular cadence.
3. Order Cycle Time
Order cycle time measures the span from when a customer places an order to when it leaves your facility – sometimes called order-to-ship time. It’s distinct from delivery time, which includes carrier transit. Cycle time is entirely within your control. Delivery time is partly the carrier’s problem. Treating them as the same metric obscures where the delay actually lives.
A 24-hour order cycle time was competitive a few years ago. For most product categories today, customer expectations have compressed to same-day or next-morning processing for standard orders. If your cycle time is running above 24 hours outside of peak periods, the bottleneck is usually in one of three places: order routing from your e-commerce platform to your warehouse management system, pick throughput in the warehouse, or a hold in the pack-and-verify step. Time-stamp each stage separately to find which one is adding the lag.
Track cycle time by order type and SKU complexity, not just as a single average. A simple single-item order and a 12-piece kitted order should have different benchmarks. Averaging them together produces a number that’s meaningless for diagnosing either.
4. Fill Rate
Fill rate measures the percentage of ordered units you can actually ship from available inventory. A 95% fill rate means that for every 100 units ordered, 5 are backordered, out of stock, or partially fulfilled. For e-commerce brands, the practical impact is a split shipment, a backorder notification, or a canceled line item – none of which the customer considers acceptable if your product page showed the item as in stock.
Fill rate has two distinct components worth tracking separately. Order fill rate measures the percentage of orders fulfilled completely (all items, full quantities). Line item fill rate measures completion at the individual SKU level. A brand with 10 SKUs can have a strong order fill rate overall while one SKU routinely causes partial fulfillments. The line item view surfaces that problem; the order-level view buries it.
Low fill rates usually trace back to forecasting gaps or replenishment timing mismatches. If you’re managing inventory across a 3PL warehousing facility, your reorder point calculations need to account for lead time from your supplier to the 3PL, not just your internal processing time. That lead time is often longer than brands plan for, and the fill rate is where you see the cost of underestimating it.
Mid-article summary:
The first four KPIs – order accuracy, on-time ship rate, order cycle time, and fill rate – measure the operational execution of your fulfillment process. The next three – return rate, cost per order, and inventory turnover – measure the financial and customer experience consequences of how that execution performs over time. You need both sets to run a fulfillment operation with actual visibility.
5. Return Rate
Return rate is total units returned divided by total units shipped. For e-commerce, average return rates vary sharply by category – apparel runs higher than consumables, and marketplace channels often run higher than direct-to-consumer because marketplace buyers have less pre-purchase context about the product. Knowing your category baseline matters before you decide whether your return rate is a problem.
What matters more than the overall rate is the return reason breakdown. Wrong item sent is a fulfillment failure. Item not as described is a content or photography problem. Item arrived damaged is a packaging and carrier problem. Customer changed mind is a buyer behavior pattern you can influence through product page clarity. Each reason code points to a different fix. A fulfillment operation tracking only overall return rate is missing most of the signal.
Returns that require reprocessing – inspection, repackaging, and restocking – add cost at every step. Brands running high return volumes benefit from a defined returns management process that separates resaleable from non-resaleable units at intake and routes each appropriately. A 3PL with reverse logistics capabilities handles this more cost-effectively than most in-house operations can at scale.
6. Cost Per Order
Cost per order (CPO) is total fulfillment cost divided by total orders shipped for a given period. Fulfillment cost includes receiving, storage, pick and pack labor, packaging materials, and outbound shipping. It excludes customer acquisition cost and product cost – those belong in separate calculations. CPO is the number that tells you whether your fulfillment operation is getting more or less efficient as you scale.
A healthy CPO trend line falls as volume grows, because fixed costs like warehouse rent and management overhead spread across more orders. If your CPO is rising with volume, something structural is wrong: either your variable costs are scaling faster than your order volume (labor inefficiency, excessive dunnage, dimensional weight overcharges on packaging), or your fixed cost base has grown ahead of your volume (too much space, too many management layers for the throughput you’re running).
Break CPO into its component parts rather than tracking the aggregate alone. Shipping cost per order is worth watching separately because it’s often the largest single component and the one most sensitive to packaging decisions, carrier mix, and zone distribution. If you’re shipping most orders from a single facility that’s geographically far from a high concentration of your customers, your per-order shipping cost will run high regardless of operational efficiency. Zone skipping or adding a second fulfillment location changes that calculation.
7. Inventory Turnover
Inventory turnover measures how many times your total inventory sells through and gets replaced in a given period. The formula is cost of goods sold divided by average inventory value. A higher turnover rate generally signals healthy demand relative to stock levels. A low turnover rate signals excess inventory carrying costs – you’re paying to store product longer than necessary.
The target turnover rate is category-dependent. Consumables with short replenishment cycles and predictable demand can run high turns efficiently. Seasonal products or long-tail SKUs naturally turn more slowly. The metric is most useful when tracked per SKU rather than across your entire catalog, because a strong overall turn rate can mask slow-moving inventory in your tail that’s quietly accumulating storage fees.
For brands storing inventory at a 3PL, slow-moving SKUs have a direct cost: monthly storage fees that compound over time. Reviewing turnover by SKU monthly lets you identify which products need a promotions push, a price adjustment, or a liquidation decision before the storage cost exceeds the margin you’d recover from selling them at full price.
Bonus: Carrier Performance Metrics
Carrier performance sits slightly outside the fulfillment operation itself, but the impact lands on your customers the same way an internal failure does. Two carrier metrics worth tracking are on-time delivery rate (percentage of shipments delivered by the carrier’s promised date) and damage rate (percentage of shipments that arrive with carrier-caused damage).
Your shipping carrier or multi-carrier platform should be able to pull both numbers by carrier and service level. If one carrier is consistently running a lower on-time delivery rate on a specific lane or service tier, that’s actionable data for re-allocating volume to a better performer on that route. Tracking this separately from your on-time ship rate keeps your internal performance and your carrier’s performance from being confused with each other in your reporting.
Building a Reporting Cadence That Works
Tracking KPIs is only useful if the data reaches the people who can act on it, at a frequency that lets them act before a problem compounds. For most e-commerce operations, a weekly fulfillment dashboard covering order accuracy, on-time ship rate, and cycle time gives the team enough visibility to catch operational slippage in real time. Return rate and cost per order work well on a monthly review cycle. Inventory turnover and fill rate are quarterly or monthly depending on how frequently you replenish.
If you’re working with a 3PL, your fulfillment partner should be able to provide a regular reporting package that covers at minimum order accuracy, on-time ship rate, and receiving turnaround time. If your current partner can’t generate that data, or doesn’t share it proactively, that’s a gap in your operational visibility that grows more costly as your volume scales. A partner structured for end-to-end order fulfillment should treat performance reporting as part of the service, not an optional add-on.
The brands that use KPIs most effectively treat them as diagnostic tools, not scorecards. A number outside your target range is a question, not a verdict. The question is: where in the process did this happen, and what does the data at the next level down tell me about the cause? Build that diagnostic habit into your review process and the metrics will compound into genuine operational improvements over time.
Perguntas mais frequentes
What is a good order accuracy rate for e-commerce fulfillment?
A strong order accuracy rate for e-commerce fulfillment is 99.5% or higher, with best-in-class operations reaching 99.9%. Below 99.5% typically indicates a systemic pick process issue – missing barcode scan verification, poor bin organization, or SKU misidentification – rather than isolated human error. At high order volumes, even a 99.7% rate produces hundreds of incorrect shipments per month.
What is order cycle time in fulfillment?
Order cycle time is the elapsed time between when a customer places an order and when that order ships from the fulfillment facility. It measures only the time within the warehouse or 3PL’s control and excludes carrier transit time. A standard benchmark for most e-commerce categories is same-day to 24-hour cycle time for orders placed during business hours. Anything above 48 hours outside of peak periods signals a throughput or routing bottleneck.
What is fill rate in e-commerce?
Fill rate in e-commerce is the percentage of ordered units that can be shipped from available inventory without backorder or substitution. A 98% fill rate means 2% of ordered units are unavailable at the time of the order. Fill rate is tracked at two levels: order fill rate (percentage of orders fully fulfilled) and line item fill rate (percentage of individual SKU quantities fulfilled). Both matter; the line item view is more useful for diagnosing specific inventory gaps.
How do you calculate cost per order in fulfillment?
Cost per order is calculated by dividing total fulfillment costs for a period by the total number of orders shipped in that period. Fulfillment costs include inbound receiving, storage fees, pick and pack labor, packaging materials, and outbound shipping. Product cost and customer acquisition cost are excluded. Tracking cost per order monthly and breaking it into components – especially separating shipping cost per order from labor cost per order – gives you the most actionable view of where efficiency gains are possible.
What fulfillment KPIs should I ask a 3PL to report on?
At minimum, ask a 3PL to report on order accuracy rate, on-time ship rate, order cycle time (order-to-ship), fill rate, and receiving turnaround time (how quickly inbound inventory is processed and made available for fulfillment). A capable 3PL should be able to generate these figures on a weekly or monthly cadence from their warehouse management system. If a prospective partner can’t commit to reporting on these metrics, treat that as a signal about their operational transparency and technology infrastructure.
Work with a 3PL Built for Visibility
Texas Logistics Services provides pick, pack and ship fulfillment for e-commerce brands from our facility in Sugar Land, TX. We track order accuracy, on-time ship rate, and cycle time as standard operating metrics and share performance data with our clients on a regular basis.
If your current fulfillment setup doesn’t give you the KPI visibility you need to make good operational decisions, contact us at (346) 766-2151 or visit texaslogisticservices.com to talk through what a reporting-capable partnership looks like.
